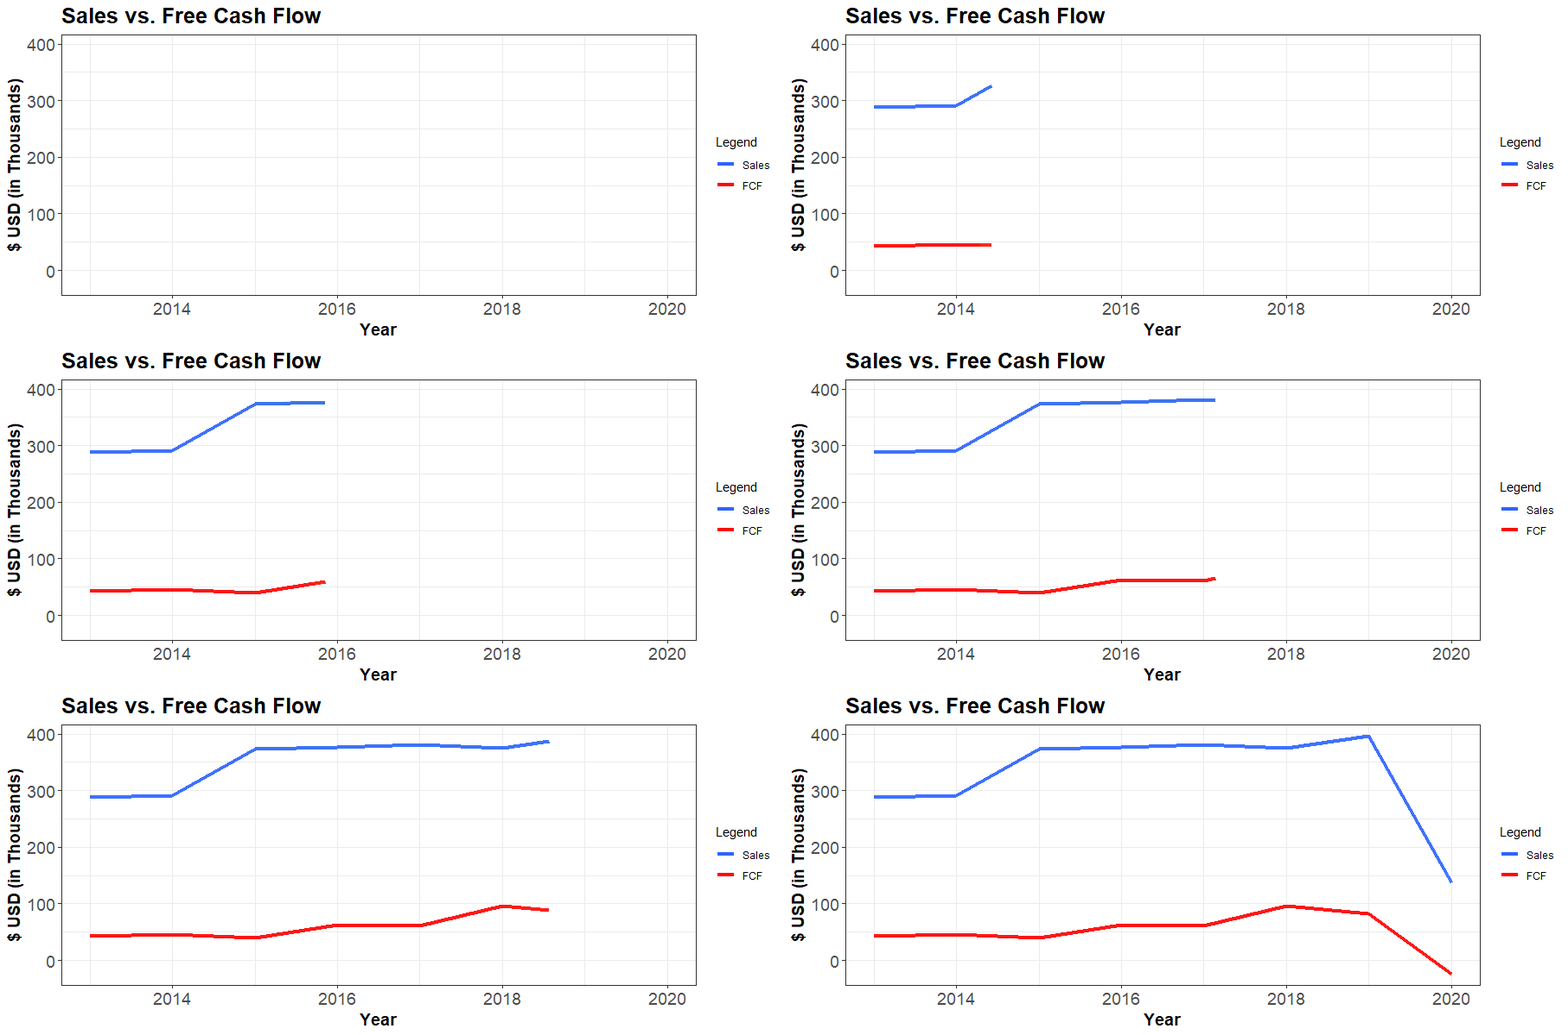
Building on the previous section, let’s further breakdown the Enterprise Value formula.
\[\begin{eqnarray} EV &=& \left [ \Large \sum_{t=1}^N \normalsize \frac{FCF_t}{(1+WACC)^t} + \frac{\text{Terminal Value}}{(1+WACC)^N} \right] (1+WACC)^{0.5}\\ \\ \\ &=& \underbrace{ \left[ \Large \sum_{t=1}^N \normalsize \frac{FCF_t}{(1+\textcolor{red}{\frac{E}{E+D}R_e + \frac{D}{E+D}R_d(1-T_c)})^t} + \frac{\text{Terminal Value}}{(1+\textcolor{red}{\frac{E}{E + D}R_e + \frac{D}{E+D}R_d(1-T_c)})^N}\right]}_\textcolor{red}{\text{Use Excel's NPV function}} \left(\normalsize 1+\textcolor{red}{\scriptsize \frac{E}{E+D}\normalsize R_e + \scriptsize \frac{D}{E+D}\normalsize R_d(1-T_c)})^{0.5} \right)\\ \end{eqnarray}\]
The reason we take \(\small (1+WACC)^{0.5}\) is due to the underlying assumption that incoming cash flows continuously at any given year, and as such, it would be a misguided effort to calculate this value at year end.
Effectively, the formula breaks down to =NPV(rate, value range)*\((\small 1+WACC)^{0.5}\) in Excel.
Enterprise Value = $(77,382.24) <– =NPV(B5,D10:H10)*(1+B5)^0.5
Based upon the WACC we calculated in the previous section, we are going to create our valuation workbook as follows:
| A | B | C | D | E | F | F | G | H | |
| 1 | IMAX Corporation - Valuation | Formula | |||||||
| 2 | Free cash flow (FCF) year ending 31 Dec. 2020 | -23,708.00 | <– =ProForma!I186 | ||||||
| 3 | Growth rate of FCF, years 1-5 (optimistic) | -4.95% | <– =ProForma!I188 | ||||||
| 4 | Long-term FCF growth rate (pessimistic) | -71.35% | <– =ProForma!I189 | ||||||
| 5 | WACC | 15.18% | <– =WACC!B33*0.01 | ||||||
| 6 | |||||||||
| 7 | Year | 2020 | 2021 | 2022 | 2023 | 2024 | 2025 | Formula | |
| 8 | FCF (Forecast) | -$22,533.85 | -$21,417.85 | -$20,357.12 | -$19,348.93 | -$18,390.66 | <– =G\(8*(1+\)B$3) | ||
| 9 | Terminal value | -$6,088.11 | <– =H8*(1+B4)/(B5-B4) | ||||||
| 10 | Total | -$22,533.85 | -$21,417.85 | -$20,357.12 | -$19,348.93 | -$24,478.77 | <– =SUM(H8:H9) | ||
| 11 | |||||||||
| 12 | Enterprise value | -$77,382.24 | <– =NPV(B5,D10:H10)*(1+B5)^0.5 | ||||||
| 13 | Add back initial cash and marketable securities | $317,379.00 | <– =ProForma!I58 | ||||||
| 14 | Subtract out 2020 financial liabilities | $532,983.00 | <– =ProForma!I122 | ||||||
| 15 | Equity Value | -$292,986.24 | <– =B12+B13-B14 | ||||||
| 15 | Per Share (1 million shares outstanding) | -0.29 | <– =B15/1000000 |
The reason why we have to re-forecast our long-term pessimistic growth rate is because if it is not less than the WACC, we will effectively calculate a terminal value of less than “0.” The company CANNOT reinvest beyond the discount rate (past 100%).
\[\begin{eqnarray} \text{Terminal Value} &=& \frac{FCF_t(1+g)}{(WACC-g)}; \text{where } t = 5 \longrightarrow \text{last year} = 5\\ \\ \text{Terminal Value} &=& \frac{\text{(Last year of forecasted cash flow) x (1 + long term growth rate)}}{\text{WACC – long term growth rate}} \end{eqnarray}\]
We will use the ROIC approach to:
- compute normalized earnings and/or cash flow instantaneously
- Map out the variables of these calculations and reference them back to the Pro Forma
- Estimate pessimistic cash flows
- Estimate optimistic cash flows
ROIC: Return on Investment Capital.
\[\begin{eqnarray} \text{Normalized Return assets (pre-tax)} &=& \frac{\text{EBIT}}{\text{Total Assets}}\\ \\ \text{ROIC} &=& \frac{\text{EBIT (1-tax rate)}}{\text{Total Assets}}\\ \end{eqnarray}\]
This method takes into account historic averages, market cap, and makes assumptions based upon other variables to drive calculations.
We discussed equity and cost of equity while covering WACC and CAPM, but let us refresh here:
\[\begin{eqnarray}
\text{Equity = market cap} &=& \frac{\text{share price}}{\text{shares outstanding}}\\
\\
\text{Cost of Equity} &=& \text{Risk Free Rate of Return +} \\
& & \text{(Beta * Expected Return of Market) - (Risk-Free Rate of Return)}\\
\\
&=& \text{US Treasury Rate + (Beta * Market Premium)}\\
\\
&=& \text{FCFE = free cash flow to equity = Net Income - (CAPEX - Depreciation) x (1 - Debt Ratio)}
\end{eqnarray}\]
| 2013 | 2014 | 2015 | 2016 | 2017 | 2018 | 2019 | 2020 | |
| Revenue | 287,937.00 | 290,541.00 | 373,805.00 | 377,334.00 | 380,767.00 | 374,401.00 | 395,664.00 | 137,003.00 |
| Free Cash Flow | 42,017.00 | 46,501.00 | 40,428.00 | 62,594.00 | 61,223.00 | 96,604.00 | 82,955.00 | -23,708.00 |
