Pro Forma Financial Analysis

The Wall Street Journal is an excellent resource for data mining, albeit not all reports are downloadable into excel (only the Historical Prices are). For this reason, we must copy and paste the income statement, balance sheet, and statement of cash flow separately into Excel in order to build an all-encompassing pro forma statement. However, in so doing, we build an automated process (macro) that takes the pasted data and arranges it in such a way that helps our efforts and is aesthetically sound.
What is a pro forma statement?

Pro Forma Financial Analysis

Pro Forma

  • Latin term translating to “for the sake of form.”

Financial Analysis

  • Income Statement
  • Balance Sheet
  • Statement of Cash Flows

As we discussed in our introduction, we can obtain the financials of any publicly traded company via:

Piecing together a pro forma from the investor relations section of the company’s website can prove to be quite cumbersome.

  • Some companies don’t have exportable excel files
  • Makes the workload more tedious and time consuming
  • It confuses certain line items that are available in other reliable sources

Income Statement

  • A company’s performance measured by revenues and expenses
  • In Economics:
    Profit: \(\pi\) = TR - TC
  • In Finance/ Accounting:
    Profit = Revenue – Cost
  • Operating Income (or Loss) = Total Revenue – Total Operating Expenses
  • EBIT = Earnings Before Interest and Taxes
  • Net Income from Continuing Operations = Total Other Income (and/or Expenses) Net + EBIT – Income Tax Expense

Balance Sheet

  • Assets = Liabilities + Shareholder’s Equity

Cash Flow Statement

  • Cash from Operating Activities
  • Cash from Investing Activities
  • Cash from Financing Activities
  • We are going to compute Free Cash Flow (FCF) and use the discounted cash flow model (DCF) to valuate a company.
  • Before we compute the FCF, let’s remember that financing activities of the cash flow statement can be disregarded.
  • FCF = Operating activities – Capital Expenditures (CAPEX)


Recording Our First Macro

We will record a macro (automated process) that will create a script on the back end (in VBA).

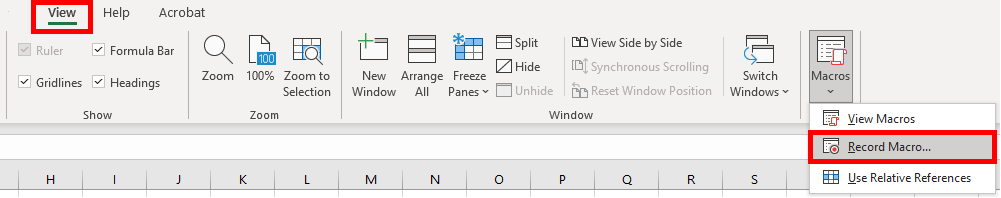
  1. In Excel, click on “View,” then “Macros,” and click on “Record Macro.”

  1. Make sure that you have your steps mapped out such that you do not make any mistakes in the process (i.e., accidentally click or type somewhere that was not intended).

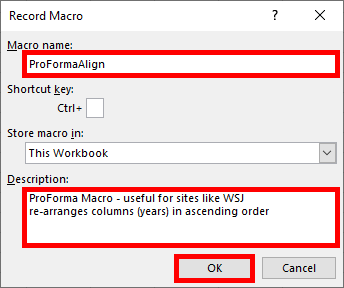
  2. Ensure that you name your macro such that it DOES NOT contain any spaces.

  3. Write-up an optional description.

  4. Click “OK.”

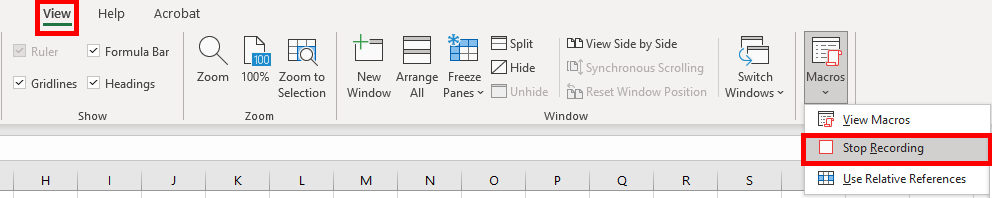
  5. Once you are finished going through the process of recording a macro, go back to “View,” “Macros,” and ensure to click on “Stop Recording.”

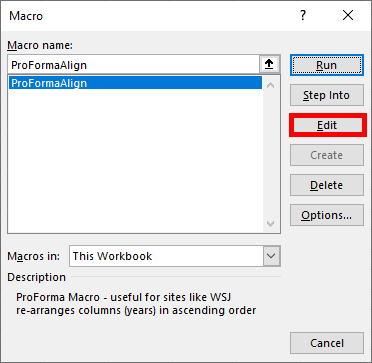
  1. To view the resulting script, go back to the process in the diagram above.
  2. The resulting dialog box pops up. Click “Edit.”

  1. Let’s name our macro: “WSJProForma.”
  2. Let’s add the following description:
    “ProForma Macro – useful for sites like WSJ
    re-arranges columns (years) in ascending order”

  3. Select all data in range: (column A – column K).
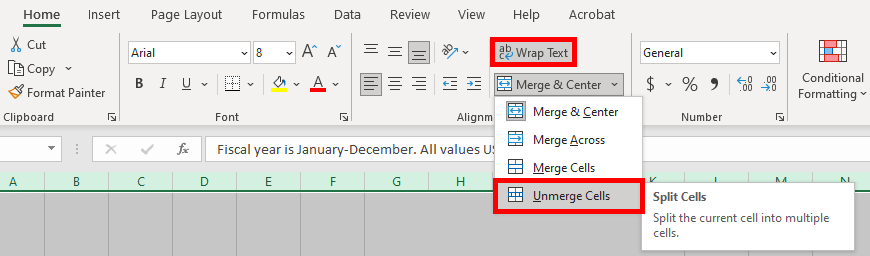
  4. Unselect “Wrap Text.”
  5. With the data still selected, click on “Unmerge Cells.”

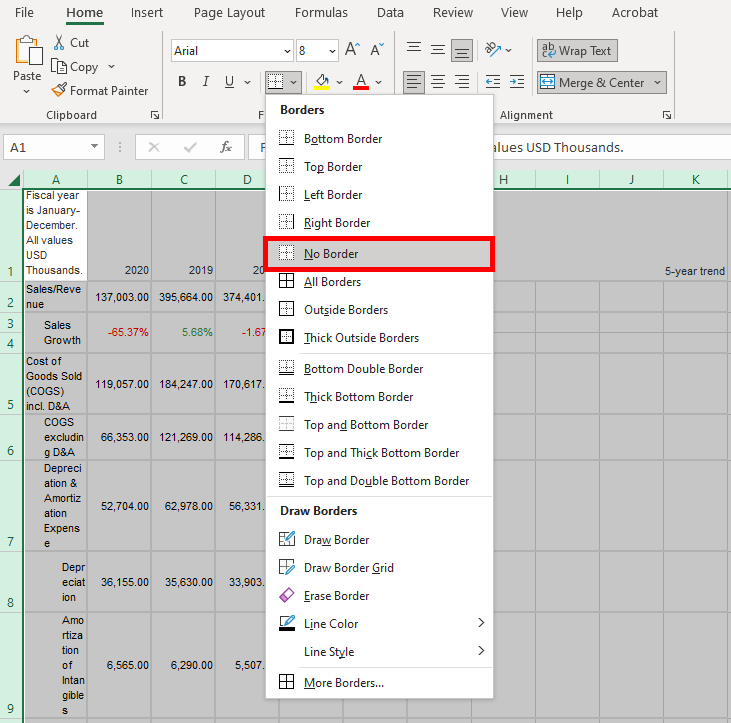
  1. Get rid of the border surrounding the data set (you want to ensure to remove all borders in columns A-K ).

  1. Insert a blank column in front of column B (where the header is marked as 2020).
  2. Repeat step 7 (above) 4 times until 4 blank columns are created in front of 2020. You can do this by pressing down ctrl + y on your keyboard 3 more times as a shortcut. The reason for creating 4 more columns to the front of 2020 is so that we can proceed to rearrange the years in chronological order.
  3. Highlight column J (where the header is marked as year 2016), copy the data, and paste the data into column A. Do the same for columns I – F , until all the dates are rearranged in chronological order.
  4. If there is any data in column K: such as “5 year-trend, etc.,” ensure to delete it. You can do this by deleting column K in its entirety. Data in column K is what was left over from the copying and pasting of original data.
  5. Go back to column A , highlight it, and align it to the left.
  6. This concludes the steps for this macro. Ensure to go back to the View tab on top of the Excel menu, go to “Macros,” and click on “Stop Recording.”

This takes us to the VBA Editor. On the back end, a screenshot of the script for the macro is shown below:

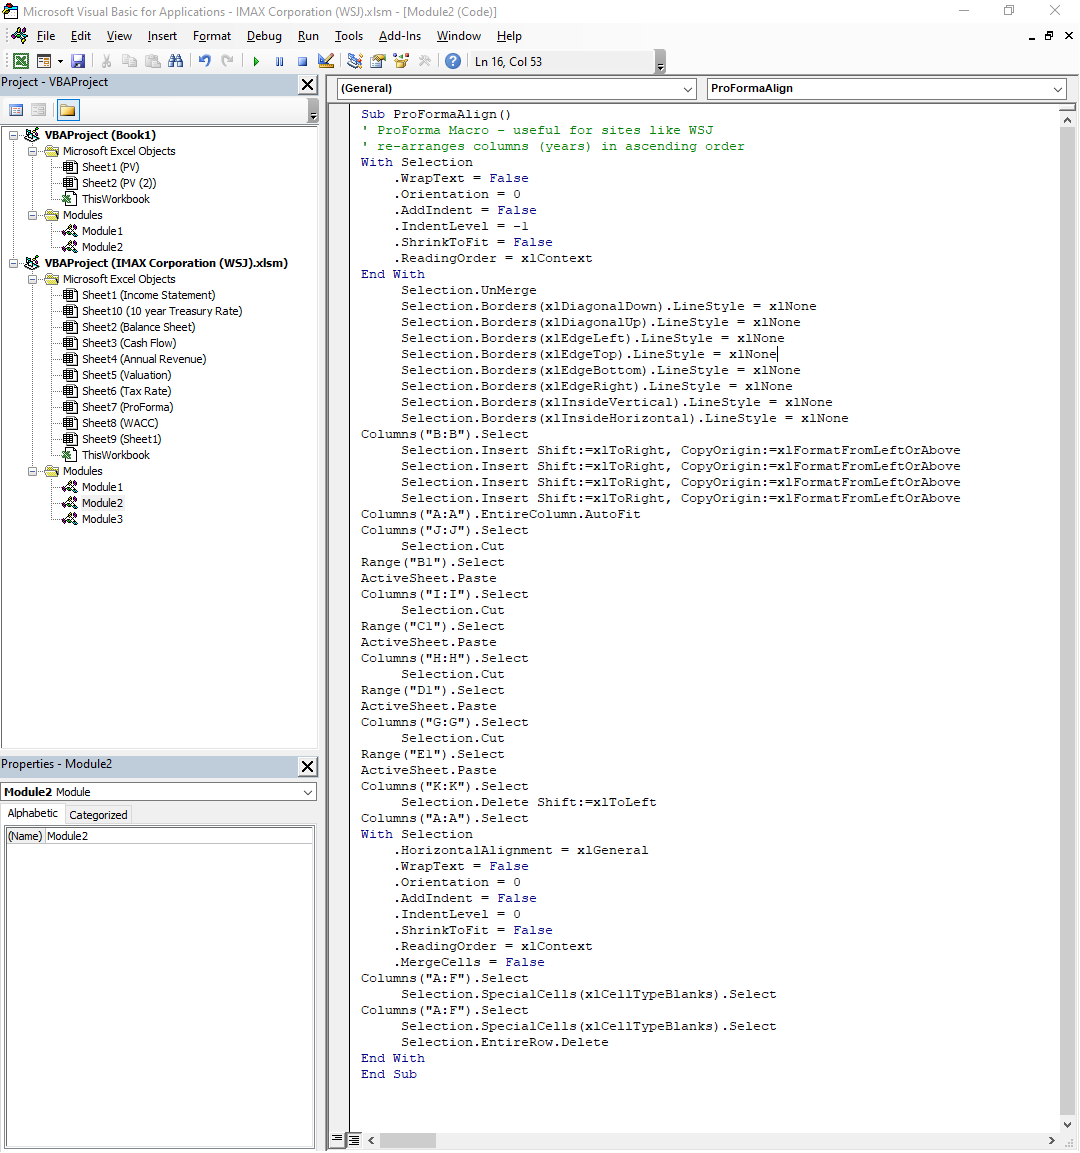
Wall Street Journal Pro Forma Macro (Script)


Sub ProFormaAlign()
' ProForma Macro - useful for sites like WSJ
' re-arranges columns (years) in ascending order

With Selection
    .WrapText = False
    .Orientation = 0
    .AddIndent = False
    .IndentLevel = -1
    .ShrinkToFit = False
    .ReadingOrder = xlContext
End With
     Selection.UnMerge
     Selection.Borders(xlDiagonalDown).LineStyle = xlNone
     Selection.Borders(xlDiagonalUp).LineStyle = xlNone
     Selection.Borders(xlEdgeLeft).LineStyle = xlNone
     Selection.Borders(xlEdgeTop).LineStyle = xlNone
     Selection.Borders(xlEdgeBottom).LineStyle = xlNone
     Selection.Borders(xlEdgeRight).LineStyle = xlNone
     Selection.Borders(xlInsideVertical).LineStyle = xlNone
     Selection.Borders(xlInsideHorizontal).LineStyle = xlNone
Columns("B:B").Select
     Selection.Insert Shift:=xlToRight, CopyOrigin:=xlFormatFromLeftOrAbove
     Selection.Insert Shift:=xlToRight, CopyOrigin:=xlFormatFromLeftOrAbove
     Selection.Insert Shift:=xlToRight, CopyOrigin:=xlFormatFromLeftOrAbove
     Selection.Insert Shift:=xlToRight, CopyOrigin:=xlFormatFromLeftOrAbove
Columns("A:A").EntireColumn.AutoFit
Columns("J:J").Select
     Selection.Cut
Range("B1").Select
ActiveSheet.Paste
Columns("I:I").Select
     Selection.Cut
Range("C1").Select
ActiveSheet.Paste
Columns("H:H").Select
     Selection.Cut
Range("D1").Select
ActiveSheet.Paste
Columns("G:G").Select
     Selection.Cut
Range("E1").Select
ActiveSheet.Paste
Columns("K:K").Select
     Selection.Delete Shift:=xlToLeft
Columns("A:A").Select
With Selection
    .HorizontalAlignment = xlGeneral
    .WrapText = False
    .Orientation = 0
    .AddIndent = False
    .IndentLevel = 0
    .ShrinkToFit = False
    .ReadingOrder = xlContext
    .MergeCells = False
Columns("A:F").Select
     Selection.SpecialCells(xlCellTypeBlanks).Select
Columns("A:F").Select
     Selection.SpecialCells(xlCellTypeBlanks).Select
     Selection.EntireRow.Delete
End With
End Sub


Let’s save the file as a macro enabled workbook and copy and paste the remaining pro forma statements into our excel file into separate sheets. So, in effect, we will have 3 sheets:

  1. Income Statement
  2. Balance Sheet
  3. Cash Flow

Below is the pro forma for IMAX Corporation from 2013 - 2020.


IMAX Corporation Pro Forma from Wall Street Journal (2013-2020)

A B C D E F G H I J
1 Fiscal year is January-December. All values USD Thousands. 2013 2014 2015 2016 2017 2018 2019 2020 Formula
2 Income Statement
3 Sales/Revenue 287,937.00 290,541.00 373,805.00 377,334.00 380,767.00 374,401.00 395,664.00 137,003.00
4 Sales Growth - 0.90% 28.66% 0.94% 0.91% -1.67% 5.68% -65.37%
5 Cost of Goods Sold (COGS)   incl. D&A 124,952.00 118,577.00 156,377.00 176,735.00 198,540.00 170,617.00 184,247.00 119,057.00
6 COGS excluding D&A 88,267.00 85,647.00 114,590.00 130,782.00 132,295.00 114,286.00 121,269.00 66,353.00
7 Depreciation &   Amortization Expense 36,685.00 32,930.00 41,787.00 45,953.00 66,245.00 56,331.00 62,978.00 52,704.00
8 Depreciation 16,239.00 17,764.00 21,361.00 25,532.00 29,915.00 33,903.00 35,630.00 36,155.00
9 Amortization of Intangibles 2,854.00 2,988.00 3,285.00 3,235.00 4,319.00 5,507.00 6,290.00 6,565.00
10 Amortization of Deferred   Charges 17,592.00 12,178.00 17,141.00 17,186.00 32,011.00 16,921.00 21,058.00 9,984.00
11 COGS Growth - -5.10% 31.88% 13.02% 12.34% -14.06% 7.99% -35.38% <–  =(F5-E5)/E5
12 Gross Income 162,985.00 171,964.00 217,428.00 200,599.00 182,227.00 203,784.00 211,417.00 17,946.00
13 Gross Income Growth - 5.51% 26.44% -7.74% -9.16% 11.83% 3.75% -91.51%
14 Gross Profit Margin - - - - 47.86% - - 13.10%
15 SG&A Expense 98,131.00 106,898.00 121,564.00 134,342.00 135,656.00 133,038.00 129,034.00 132,933.00
16 Research & Development 14,771.00 16,096.00 12,730.00 16,315.00 20,855.00 13,728.00 5,203.00 5,618.00
17 Other SG&A 83,360.00 90,802.00 108,834.00 118,027.00 114,801.00 119,310.00 123,831.00 127,315.00
18 SGA Growth - 8.93% 13.72% 10.51% 0.98% -1.93% -3.01% 3.02%
19 EBIT 64,854.00 65,066.00 95,864.00 66,257.00 46,571.00 70,746.00 82,383.00 -114,987.00
20 Unusual Expense -1,258.00 4,510.00 2,476.00 4,111.00 17,399.00 24,273.00 3,567.00 9,137.00
21 Non Operating Income/Expense -1,012.00 -2,486.00 -5,517.00 -3,978.00 1,754.00 -1,796.00 -2,792.00 -378.00
22 Non-Operating Interest Income 55 405 968 1,490.00 1,027.00 1,844.00 2,105.00 2,388.00
23 Interest Expense 1,345.00 1,124.00 1,761.00 1,805.00 1,942.00 2,916.00 2,793.00 7,010.00
24 Interest Expense Growth - -16.43% 56.67% 2.50% 7.59% 50.15% -4.22% 150.98%
25 Gross Interest Expense 1,345.00 1,124.00 1,761.00 1,805.00 1,942.00 2,916.00 2,793.00 7,010.00
26 Pretax Income 63,810.00 57,351.00 87,078.00 57,853.00 30,011.00 43,605.00 75,336.00 -129,124.00
27 Pretax Income Growth - -10.12% 51.83% -33.56% -48.13% 45.30% 72.77% -271.40%
28 Pretax Margin - - - - 7.88% - - -94.25%
29 Income Tax 16,629.00 14,466.00 20,052.00 16,212.00 16,790.00 9,518.00 16,768.00 26,504.00
30 Income Tax - Current Domestic 1,068.00 3,495.00 10,862.00 1,396.00 6,898.00 4,893.00 -2,369.00 -555.00
31 Income Tax - Current Foreign 2,662.00 10,344.00 10,526.00 9,873.00 13,909.00 11,548.00 12,375.00 3,441.00
32 Income Tax - Deferred Domestic 13,198.00 -433 518 3,583.00 -8,748.00 -5,993.00 3,913.00 10,801.00
33 Income Tax - Deferred Foreign -299 1,060.00 -1,854.00 1,360.00 4,731.00 -930.00 2,849.00 12,817.00
34 Equity in Affiliates -2,757.00 -1,071.00 -2,402.00 -2,321.00 -703 -492 3 -1858
35 Other After Tax Income   (Expense) - -426 -769 - - - -
36 Consolidated Net Income 44,424.00 41,388.00 63,855.00 39,320.00 12,518.00 33,595.00 58,571.00 -157,486.00
37 Minority Interest Expense - 2,433.00 8,780.00 10,532.00 10,174.00 10,751.00 11,705.00 -13,711.00
38 Net Income 44,424.00 38,955.00 55,075.00 28,788.00 2,344.00 22,844.00 46,866.00 -143,775.00
39 Net Income Growth - -12.31% 41.38% -47.73% -91.86% 874.57% 105.16% -406.78% <–  =(F38-E38)/E38
40 Net Margin - - - - 0.62% - - -104.94%
41 Extraordinaries &   Discontinued Operations -309 355 - - - - - -
42 Discontinued Operations -309 355 - - - - - -
43 Net Income After   Extraordinaries 44,733.00 38,600.00 55,075.00 28,788.00 2,344.00 22,844.00 46,866.00 -143,775.00
44 Net Income Available to Common 44,115.00 39,310.00 55,075.00 28,788.00 2,344.00 22,844.00 46,866.00 -143,775.00
45 EPS (Basic) 0.66 0.58 0.79 0.43 0.04 0.36 0.76 -2.43
46 EPS (Basic) Growth - -12.85% 37.34% -45.57% -90.70% 805.50% 111.04% -417.52%
47 Basic Shares Outstanding 67,151.00 68,346.00 69,526.00 67,575.00 65,380.00 63,075.00 61,310.00 59,237.00
48 EPS (Diluted) 0.64 0.56 0.78 0.42 0.04 0.36 0.76 -2.43
49 EPS (Diluted) Growth - -11.91% 37.53% -45.59% -91.52% 910.55% 110.89% -418.44%
50 Diluted Shares Outstanding 68,961.00 69,754.00 71,058.00 68,263.00 65,540.00 63,207.00 61,489.00 59,237.00
51 EBITDA 101,539.00 97,996.00 137,651.00 112,210.00 112,816.00 127,077.00 145,361.00 -62,283.00
52 EBITDA Growth - -3.49% 40.47% -18.48% 0.54% 12.64% 14.39% -142.85%
53 EBITDA Margin - - - - 29.63% - - -45.46%
54 EBIT 64,854.00 65,066.00 95,864.00 66,257.00 46,571.00 70,746.00 82,383.00 -114,987.00
55 Balance Sheet
56 Assets
57 Fiscal year is   January-December. All values USD Thousands. 2013 2014 2015 2016 2017 2018 2019 2020
58 Cash & Short Term   Investments 29,546.00 106,503.00 317,449.00 204,759.00 158,725.00 141,590.00 109,484.00 317,379.00
59 Cash Only 29,546.00 106,503.00 317,449.00 204,759.00 158,725.00 141,590.00 109,484.00 317,379.00
60 Cash & Short Term   Investments Growth - 260.47% 198.07% -35.50% -22.48% -10.80% -22.68% 189.89%
61 Cash & ST Investments /   Total Assets 6.14% 17.14% 34.10% 23.88% 18.32% 16.21% 12.31% 31.81%
62 Total Accounts Receivable 90,409.00 91,595.00 117,049.00 118,329.00 156,001.00 120,220.00 127,108.00 91,237.00
63 Accounts Receivables, Net 73,074.00 76,051.00 97,981.00 96,349.00 130,546.00 120,220.00 127,108.00 91,237.00
64 Accounts Receivables, Gross 73,961.00 76,998.00 99,695.00 97,599.00 132,513.00 123,250.00 132,246.00 105,532.00
65 Bad Debt/Doubtful Accounts -887 -947 -1,714.00 -1,250.00 -1,967.00 -3,030.00 -5,138.00 -14,295.00
66 Other Receivables 17,335.00 15,544.00 19,068.00 21,980.00 25,455.00 - - -
67 Accounts Receivable Growth - 1.31% 27.79% 1.09% 31.84% -22.94% 5.73% -28.22%
68 Accounts Receivable Turnover 3.18 3.17 3.19 3.19 2.44 3.11 3.11 1.5
69 Inventories 9,825.00 17,063.00 38,753.00 42,121.00 30,788.00 44,560.00 42,989.00 39,580.00
70 Finished Goods 5,004.00 6,705.00 10,375.00 10,303.00 6,981.00 10,122.00 11,843.00 6,470.00
71 Work in Progress 500 1,211.00 2,628.00 3,818.00 2,601.00 4,733.00 4,608.00 3,014.00
72 Raw Materials 4,321.00 9,147.00 25,750.00 28,000.00 21,206.00 29,705.00 26,538.00 30,096.00
73 Other Current Assets 3,602.00 4,946.00 6,498.00 6,626.00 7,549.00 10,294.00 10,237.00 10,420.00
74 Prepaid Expenses 3,602.00 4,946.00 6,498.00 6,626.00 7,549.00 10,294.00 10,237.00 10,420.00
75 Total Current Assets 133,382.00 220,107.00 479,749.00 371,835.00 353,063.00 316,664.00 289,818.00 458,616.00
76 Net Property, Plant &   Equipment 132,847.00 183,424.00 218,267.00 245,415.00 276,781.00 280,658.00 306,849.00 277,397.00
77 Property, Plant &   Equipment - Gross 225,337.00 290,436.00 328,244.00 378,203.00 427,511.00 451,979.00 497,654.00 501,384.00
78 Buildings 15,832.00 16,584.00 67,150.00 69,861.00 74,478.00 77,468.00 80,850.00 80,875.00
79 Land & Improvements 1,593.00 8,180.00 8,203.00 8,203.00 8,203.00 8,203.00 8,203.00 8,203.00
80 Construction in Progress 8,055.00 43,250.00 9,616.00 18,315.00 23,398.00 24,327.00 14,483.00 5,660.00
81 Leases - - - - - - 17147 15553
82 Leased Property 162,783.00 184,489.00 205,367.00 230,629.00 270,016.00 292,146.00 327,684.00 342,670.00
83 Other Property, Plant &   Equipment 37,074.00 37,933.00 37,908.00 51,195.00 51,416.00 49,835.00 49,287.00 48,423.00
84 Accumulated Depreciation 92,490.00 107,012.00 109,977.00 132,788.00 150,730.00 171,321.00 190,805.00 223,987.00
85 Buildings 10,410.00 10,998.00 12,679.00 14,877.00 17,364.00 20,012.00 22,931.00 25,921.00
86 Leases 54,273.00 66,736.00 77,936.00 92,950.00 107,861.00 124,112.00 137,978.00 163,300.00
87 Leased Property 54,273.00 66,736.00 77,936.00 92,950.00 107,861.00 124,112.00 137,978.00 163,300.00
88 Other Property, Plant &   Equipment 27,807.00 29,278.00 19,362.00 24,961.00 25,505.00 27,197.00 29,011.00 33,124.00
89 Total Investments and Advances 5,784.00 3,384.00 2,198.00 3,869.00 11,358.00 5,244.00 19,742.00 16,612.00
90 LT Investment - Affiliate   Companies 5,784.00 3,384.00 2,198.00 1,389.00 3,484.00 - 15,685.00 13,633.00
91 Other Long-Term Investments - - - 2,480.00 7,874.00 5,244.00 4,057.00 2,979.00
92 Long-Term Note Receivable 89,775.00 90,292.00 101,005.00 102,853.00 106,747.00 136,506.00 140,483.00 137,399.00
93 Intangible Assets 66,772.00 66,578.00 67,977.00 69,443.00 70,238.00 73,122.00 69,374.00 65,272.00
94 Net Goodwill 39,027.00 39,027.00 39,027.00 39,027.00 39,027.00 39,027.00 39,027.00 39,027.00
95 Net Other Intangibles 27,745.00 27,551.00 28,950.00 30,416.00 31,211.00 34,095.00 30,347.00 26,245.00
96 Other Assets 28,326.00 34,690.00 36,058.00 43,140.00 17,717.00 30,142.00 38,898.00 24,471.00
97 Deferred Charges 9,294.00 25,457.00 26,273.00 32,963.00 6,208.00 16,367.00 17,921.00 5,777.00
98 Tangible Other Assets 19,032.00 9,233.00 9,785.00 10,177.00 11,509.00 13,775.00 20,977.00 18,694.00
99 Total Assets 481,145.00 621,533.00 931,020.00 857,334.00 866,612.00 873,600.00 889,069.00 997,750.00
100 Assets - Total - Growth - 29.18% 49.79% -7.91% 1.08% 0.81% 1.77% 12.22%
101 Asset Turnover - - - - 0.44 - - 0.15
102 Return On Average Assets - - - - 0.27% - - -15.24%
103 All values USD Thousands. 2013 2014 2015 2016 2017 2018 2019 2020
104 ST Debt & Current Portion   LT Debt - - 2,000.00 - 2,000.00 - 18,677.00 16,634.00
105 Short Term Debt - - - - - - 18677 16634
106 Current Portion of Long Term   Debt - - 2,000.00 - 2,000.00 - - -
107 Accounts Payable 19,396.00 26,145.00 23,455.00 19,990.00 24,235.00 32,057.00 20,414.00 20,837.00
108 Accounts Payable Growth - 34.80% -10.29% -14.77% 21.24% 32.28% -36.32% 2.07%
109 Other Current Liabilities 142,164.00 163,991.00 200,741.00 183,474.00 213,410.00 204,433.00 188,654.00 170,702.00
110 Accrued Payroll 1,600.00 101.5 1,800.00 - - - - -
111 Miscellaneous Current   Liabilities 140,564.00 163,889.50 198,941.00 183,474.00 213,410.00 204,433.00 188,654.00 170,702.00
112 Total Current Liabilities 161,560.00 190,136.00 226,196.00 203,464.00 239,645.00 236,490.00 227,745.00 208,173.00
113 Current Ratio 0.83 1.16 2.12 1.83 1.47 1.34 1.27 2.2
114 Quick Ratio 0.76 1.07 1.95 1.62 1.34 1.15 1.08 2.01
115 Cash Ratio 0.18 0.56 1.4 1.01 0.66 0.6 0.48 1.52
116 Long-Term Debt - 4,710.00 27,667.00 27,316.00 23,357.00 37,753.00 18,229.00 305,676.00
117 Long-Term Debt excl.   Capitalized Leases - 4,710.00 27,667.00 27,316.00 23,357.00 37,753.00 18,229.00 305,676.00
118 Non-Convertible Debt - 4,710.00 27,667.00 27,316.00 23,357.00 37,753.00 18,229.00 305,676.00
119 Deferred Taxes -24,259.00 -23,058.00 -25,766.00 -20,779.00 -30,708.00 -31,264.00 -23,905.00 1,151.00
120 Deferred Taxes - Credit - - - - - - - 19134
121 Deferred Taxes - Debit 24,259.00 23,058.00 25,766.00 20,779.00 30,708.00 31,264.00 23,905.00 17,983.00
122 Total Liabilities 161,560.00 194,846.00 253,863.00 230,780.00 263,002.00 274,243.00 245,974.00 532,983.00
123 Total Liabilities / Total   Assets 33.58% 31.35% 27.27% 26.92% 30.35% 31.39% 27.67% 53.42%
124 Common Equity (Total) 319,585.00 382,775.00 623,891.00 562,012.00 527,746.00 512,161.00 547,694.00 385,489.00
125 Common Stock Par/Carry Value 327,313.00 344,862.00 448,310.00 439,213.00 445,797.00 422,455.00 423,386.00 407,031.00
126 Retained Earnings -43,051.00 -6,259.00 19,930.00 -47,366.00 -87,592.00 -85,385.00 -40,253.00 -202,849.00
127 Other Appropriated Reserves 35,323.00 44,172.00 155,651.00 172,104.00 174,674.00 176,007.00 168,599.00 181,318.00
128 Treasury Stock - - - -1,939.00 -5,133.00 -916.00 -4,038.00 -11.00
129 Common Equity / Total Assets 66.42% 61.59% 67.01% 65.55% 60.90% 58.63% 61.60% 38.64%
130 Total Shareholders’ Equity 319,585.00 382,775.00 623,891.00 562,012.00 527,746.00 512,161.00 547,694.00 385,489.00
131 Total Shareholders’ Equity /   Total Assets 66.42% 61.59% 67.01% 65.55% 60.90% 58.63% 61.60% 38.64%
132 Accumulated Minority Interest - 43,912.00 53,266.00 64,542.00 75,864.00 87,196.00 95,401.00 79,278.00
133 Total Equity 319,585.00 426,687.00 677,157.00 626,554.00 603,610.00 599,357.00 643,095.00 464,767.00
134 Liabilities &   Shareholders’ Equity 481,145.00 621,533.00 931,020.00 857,334.00 866,612.00 873,600.00 889,069.00 997,750.00
135 Cash Flow
136 Fiscal year is   January-December. All values USD Thousands. 2013 2014 2015 2016 2017 2018 2019 2020
137 Net Income before   Extraordinaries 44,115.00 42,169.00 64,624.00 39,320.00 12,518.00 33,595.00 58,571.00 -157,486.00
138 Net Income Growth - -4.41% 53.25% -39.16% -68.16% 168.37% 74.34% -368.88%
139 Depreciation, Depletion &   Amortization 36,685.00 32,930.00 40,887.00 45,953.00 66,245.00 56,331.00 62,978.00 52,704.00
140 Depreciation and Depletion 16,239.00 17,764.00 21,361.00 25,532.00 29,915.00 33,903.00 35,630.00 36,155.00
141 Amortization of Intangible   Assets 20,446.00 15,166.00 19,526.00 20,421.00 36,330.00 22,428.00 27,348.00 16,549.00
142 Deferred Taxes &   Investment Tax Credit 12,899.00 627 -1,336.00 4,940.00 -4,017.00 -6,923.00 6,762.00 23,618.00
143 Deferred Taxes 12,899.00 627 -1,336.00 4,940.00 -4,017.00 -6,923.00 6,762.00 23,618.00
144 Other Funds -4,911.00 4,822.00 16,088.00 18,533.00 19,761.00 14,522.00 7,994.00 61,861.00
145 Funds from Operations 88,788.00 80,548.00 120,263.00 108,746.00 94,507.00 97,525.00 136,305.00 -19,303.00
146 Changes in Working Capital -33,755.00 6,057.00 -36,578.00 -30,874.00 -9,141.00 12,447.00 -45,929.00 -3,708.00
147 Receivables -31,032.00 -4,358.00 -36,149.00 -5,909.00 -45,060.00 35,267.00 -12,997.00 20,668.00
148 Inventories 1,884.00 -7,603.00 -21,070.00 -3,825.00 10,832.00 -14,022.00 1,942.00 1,637.00
149 Accounts Payable 7,238.00 -5,186.00 9,183.00 -3,360.00 4,204.00 7,749.00 -11,774.00 414.00
150 Other Accruals -1,289.00 5,702.00 -2,577.00 3,914.00 -642 -3266 -8505 -6399
151 Other Assets/Liabilities -10,556.00 17,502.00 14,035.00 -21,694.00 21,525.00 -13,281.00 -14,595.00 -20,028.00
152 Net Operating Cash Flow 55,033.00 86,605.00 83,685.00 77,872.00 85,366.00 109,972.00 90,376.00 -23,011.00
153 Net Operating Cash Flow Growth - 57.37% -3.37% -6.95% 9.62% 28.82% -17.82% -125.46%
154 Net Operating Cash Flow /   Sales 19.11% 29.81% 22.39% 20.64% 22.42% 29.37% 22.84% -16.80%
155 All values USD Thousands. 2013 2014 2015 2016 2017 2018 2019 2020
156 Capital Expenditures -15,502.00 -43,022.00 -48,322.00 -20,065.00 -29,357.00 -22,064.00 -10,352.00 -2,601.00
157 Capital Expenditures (Fixed   Assets) -13,016.00 -40,104.00 -43,257.00 -15,278.00 -24,143.00 -13,368.00 -7,421.00 -697.00
158 Capital Expenditures (Other   Assets) -2,486.00 -2,918.00 -5,065.00 -4,787.00 -5,214.00 -8,696.00 -2,931.00 -1,904.00
159 Capital Expenditures Growth - -177.53% -12.32% 58.48% -46.31% 24.84% 53.08% 74.87%
160 Capital Expenditures / Sales -5.38% -14.81% -12.93% -5.32% -7.71% -5.89% -2.62% -1.90%
161 Net Assets from Acquisitions -4,000.00 -2,500.00 -2,000.00 -1,911.00 -1,606.00 - - -
162 Sale of Fixed Assets &   Businesses - 507 - - - -34810 -55642 -6654
163 Purchase/Sale of Investments -22,775.00 -16,838.00 -28,474.00 -42,910.00 -42,634.00 -34,810.00 -55,642.00 -6,654.00
164 Purchase of Investments -22,775.00 -16,838.00 -28,474.00 -42,910.00 -42,634.00 -34,810.00 -55,642.00 -6,654.00
165 Net Investing Cash Flow -42,277.00 -61,853.00 -78,796.00 -64,886.00 -73,597.00 -56,874.00 -65,994.00 -9,255.00
166 Net Investing Cash Flow Growth - -46.30% -27.39% 17.65% -13.43% 22.72% -16.04% 85.98%
167 Net Investing Cash Flow /   Sales -14.68% -21.29% -21.08% -17.20% -19.33% -15.19% -16.68% -6.76%
168 All values USD Thousands. 2013 2014 2015 2016 2017 2018 2019 2020
169 Change in Capital Stock 8,768.00 48,766.00 201,302.00 -102,922.00 -34,605.00 -74,915.00 -32,144.00 -41,244.00
170 Repurchase of Common &   Preferred Stk. - -3,063.00 -34,276.00 -118,514.00 -51,273.00 -83,728.00 -35,654.00 -41,244.00
171 Sale of Common & Preferred   Stock 8,768.00 51,829.00 235,578.00 15,592.00 16,668.00 8,813.00 3,510.00 -
172 Proceeds from Stock Options -202 40,995.00 199,969.00 2,479.00 - 7796 1106 -
173 Other Proceeds from Sale of   Stock 8,970.00 10,834.00 35,609.00 13,113.00 16,668.00 1,017.00 2,404.00 -
174 Issuance/Reduction of Debt,   Net -13,151.00 4,283.00 23,424.00 -2,000.00 -2,000.00 12,424.00 -20,000.00 286,537.00
175 Change in Current Debt -13,151.00 - - - - - - -
176 Change in Long-Term Debt - 4,283.00 23,424.00 -2,000.00 -2,000.00 12,424.00 -20,000.00 286,537.00
177 Issuance of Long-Term Debt - 4,283.00 23,757.00 - - 63091 35000 286537
178 Reduction in Long-Term Debt - - -333 -2,000.00 -2,000.00 -50,667.00 -55,000.00 -
179 Other Funds - -790 -19,511.00 -20,860.00 -20,931.00 -8,371.00 -4,974.00 -4,726.00
180 Other Uses - -790 -19,511.00 -20,860.00 -20,931.00 -8,371.00 -4,974.00 -4,726.00
181 Net Financing Cash Flow -4,383.00 52,259.00 205,215.00 -125,782.00 -57,536.00 -70,862.00 -57,118.00 240,567.00
182 Net Financing Cash Flow Growth - 1292.31% 292.69% -161.29% 54.26% -23.16% 19.40% 521.18%
183 Net Financing Cash Flow /   Sales -1.52% 17.99% 54.90% -33.33% -15.11% -18.93% -14.44% 175.59%
184 Exchange Rate Effect -163 -54 842 106 -267 629 630 -406
185 Net Change in Cash 8,210.00 76,957.00 210,946.00 -112,690.00 -46,034.00 -17,135.00 -32,106.00 207,895.00
186 Free Cash Flow 42,017.00 46,501.00 40,428.00 62,594.00 61,223.00 96,604.00 82,955.00 -23,708.00
187 Free Cash Flow Growth - 10.67% -13.06% 54.83% -2.19% 57.79% -14.13% -128.58% <–  =(F186-E186)/E186
188 Optimistic FCF Growth 26.32% -4.95% <–  =AVERAGE(B187:F187)
189 Pessimistic FCF Growth 12.56% -71.35% <–  =AVERAGE(E187:F187)
190 Free Cash Flow Yield - - - - 4.04% - - -2.22%
Previous
Next