Introduction
First and foremost, I would like to extend a special thank you to Professor George A. Haloulakos, MBA, CFA for his guidance, mentorship, and for teaching me this material in 2017 when I was looking to advance myself further in my career.
This material was originally rolled out to a Economics students at UCLA, summer cohort 2018. Throughout this short course, these concepts are illustrated visa vie IMAX Corporation when dealing with actual financial data. The material has been updated to reflect the specific date ranges of 06/22/2018 - 06/22/2021.
What is Financial Modeling?
Financial modeling is an endeavor to shape and/or create an abstract depiction of real financial data.
Why is it helpful or necessary?
It helps condense large data sets into simple spreadsheets that can be used as templates for gaining relevant insights into a company’s performance.
Where can we find the financials (pro forma) for a publicly traded company?
- Yahoo Finance
- Wall Street Journal
- The investor relations section of the corporation’s website
What tools will we be using?
- Microsoft Excel
- Visual Basic for Applications (VBA)
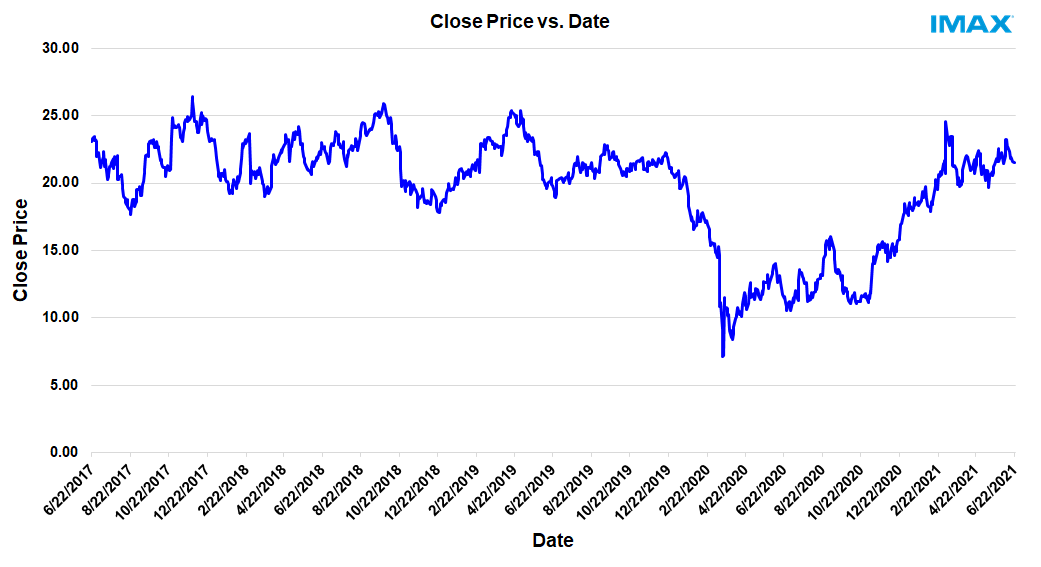
The following sample historical pricing data was imported directly from Yahoo Finance into Excel.
Once any set of data is in Excel it is EASY to manipulate it by removing or expanding what is already there.
For example, we can add % changes in prices over time and averages.
Adding these statistics involves the use of formulas.
However, removing irrelevant data can be done by hiding or deleting columns and/or rows.| Date | Open | High | Low | Close | Adj Close | Volume |
|---|---|---|---|---|---|---|
| 06/21/21 | 21.72 | 21.72 | 21.04 | 21.53 | 21.53 | 398,500 |
| 06/18/21 | 21.60 | 21.87 | 21.37 | 21.59 | 21.59 | 612,500 |
| 06/17/21 | 21.88 | 21.98 | 21.65 | 21.85 | 21.85 | 375,300 |
| 06/16/21 | 21.71 | 21.96 | 21.33 | 21.94 | 21.94 | 572,200 |
| 06/15/21 | 22.38 | 22.47 | 21.82 | 21.83 | 21.83 | 316,900 |
| 06/14/21 | 22.79 | 23.09 | 22.20 | 22.33 | 22.33 | 472,900 |
| 06/11/21 | 22.59 | 22.79 | 22.42 | 22.74 | 22.74 | 370,400 |
| 06/10/21 | 23.28 | 23.35 | 22.49 | 22.55 | 22.55 | 874,500 |
| 06/09/21 | 23.51 | 23.54 | 23.03 | 23.23 | 23.23 | 659,600 |
| 06/08/21 | 22.15 | 23.38 | 21.81 | 23.23 | 23.23 | 1,592,500 |
| 06/07/21 | 21.63 | 22.11 | 21.48 | 22.04 | 22.04 | 985,600 |
| 06/04/21 | 22.03 | 22.39 | 21.42 | 21.43 | 21.43 | 661,000 |
| 06/03/21 | 21.85 | 22.31 | 21.14 | 21.93 | 21.93 | 1,631,900 |
| 06/02/21 | 21.00 | 22.32 | 20.64 | 21.99 | 21.99 | 1,630,800 |
| 06/01/21 | 21.63 | 22.41 | 21.54 | 22.27 | 22.27 | 809,700 |
| 05/28/21 | 22.82 | 23.57 | 21.53 | 21.61 | 21.61 | 1,180,800 |
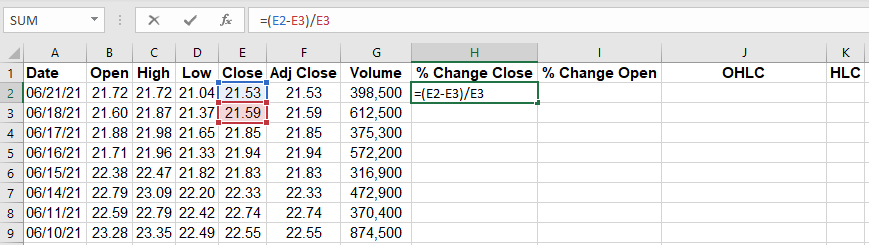
When looking at the percent change between 2 values, subtract the old value from the new value and divide the result by the old value as shown:
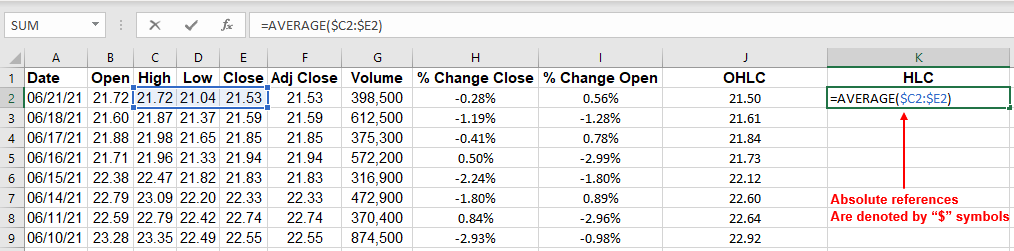
To get the Open, High, Low, Close (OHLC), we take the average of the cells B2:E2 as shown by the excel formula =AVERAGE($B2:$E2) below. We bring the formula down to the rest of the cells by clicking on the right corner of cell J2, following the same procedure for HLC, starting in cell K2.
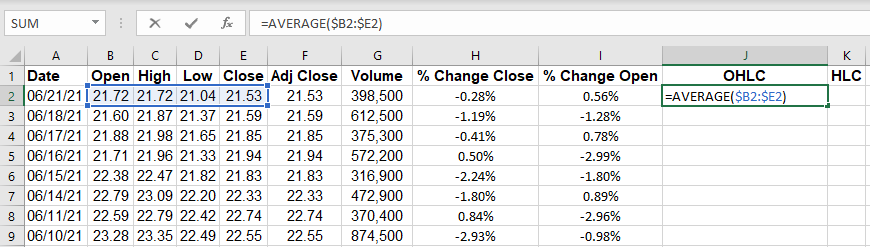
Let’s not forget to adjust the formula in the HLC and the OHLC averages by locking in these absolute references.
Before we proceed with more built-in Excel formulas, let us delve into a little bit of VBA (Visual Basic for Applications). VBA is the back-end programming language of Microsoft Excel and other Microsoft Office programs. It is important to ensure that our Microsoft Excel package has the Developer Tab added onto it.
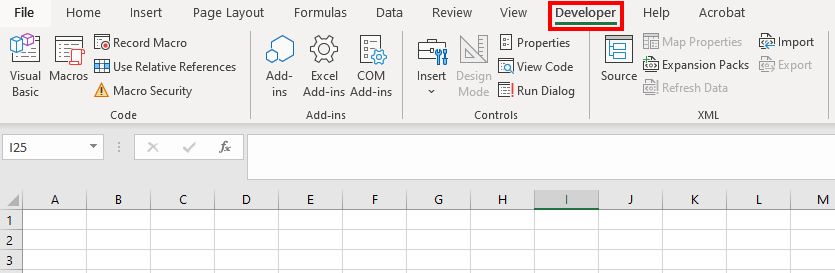
This step is NOT mandatory for entering the visual basic editor but is necessary if you are recording macros to automate various processes.
If you are just writing code (i.e. coding a function), you can enter the VBA environment simply by pressing ALT + F11 on your keyboard.
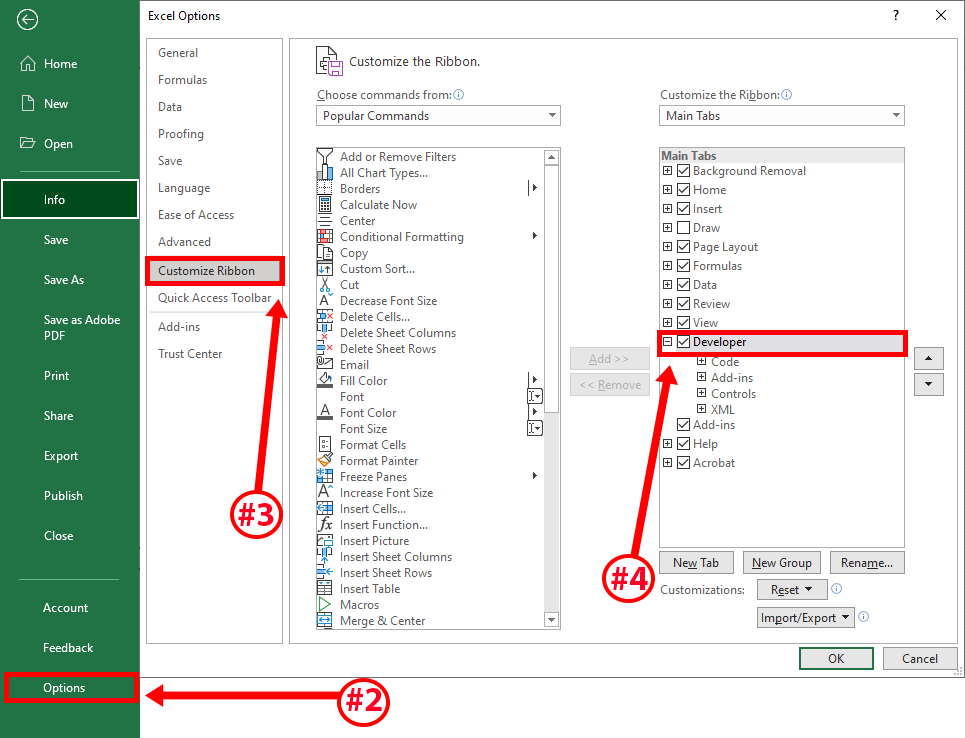
1. Click on “File.”
2. Click on “Options.”
3. Click on “Customize Ribbon.”
4. Make Sure there is a check mark next to “Developer.”
We’re not going to cover the entirety of VBA programming but will work with the basics.
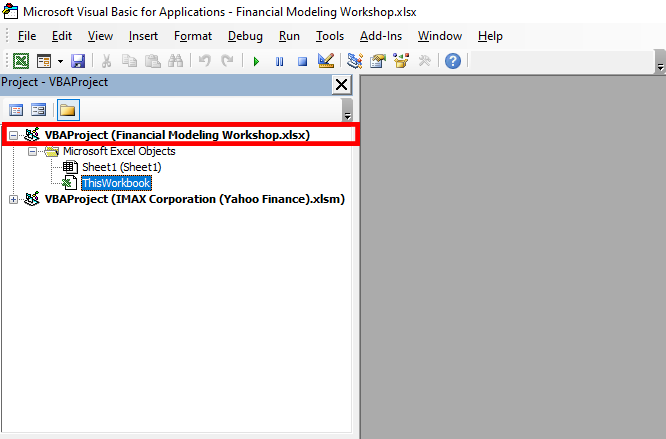
We want to ensure that we are looking at the correct VBA Project. The project name is the name of the Excel File that you are working within. In this case, it is called: “Financial Modeling Workshop.xlsx.”
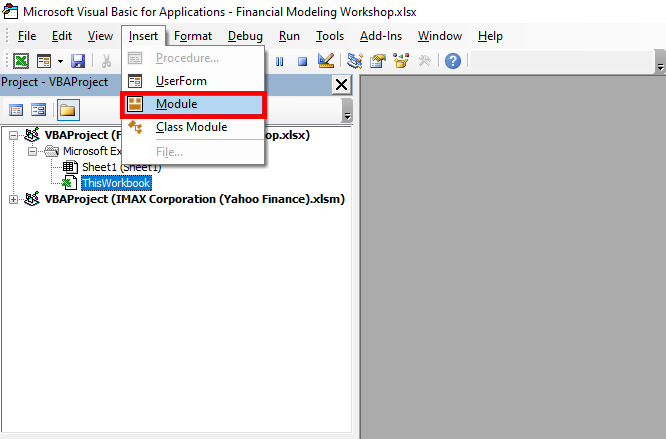
In any event, VBA script is inserted into what is called a “module.” So, to insert a module, simply click on “Insert” followed by “Module” from the top menu.
Let’s start by writing a basic function.
One of the most used functions in Financial Modeling is “getformula.” It simply tells us what formula we plugged into any given cell.
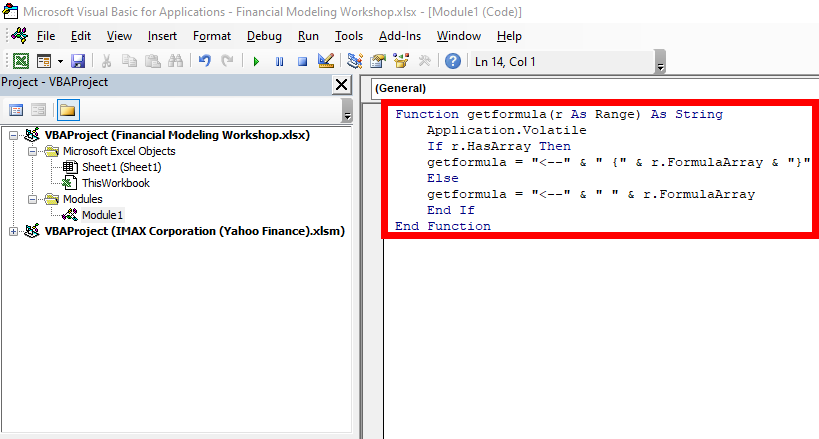
Function getformula(r As Range) As String
Application.Volatile
If r.HasArray Then
getformula = "<–" & " {" & r.FormulaArray & "}"
Else
getformula = "<–" & " " & r.FormulaArray
End If
End Function