Animated Principal Component Analysis (PCA) in R


Requisite packages and libraries for this task in RStudio

  1. Install the following packages and load relevant library(ies) as shown in the R chunk below:
  • devtools - development tools package
  • factoextra - used for extracting and visualizing results of multivariate analyses
  • gganimate- used animating ggplots.
install.packages("devtools")
library(devtools)
install_github("kassambara/factoextra")
install.packages("gganimate")
  1. Load the necessary libraries.
library(factoextra)
library(gganimate)

Applying gganimate to Principal Component Analysis from iris dataset

  1. Read in the iris flower dataset by calling data(iris) and inspect it with head(iris)
data(iris)
head(iris)
##   Sepal.Length Sepal.Width Petal.Length Petal.Width Species
## 1          5.1         3.5          1.4         0.2  setosa
## 2          4.9         3.0          1.4         0.2  setosa
## 3          4.7         3.2          1.3         0.2  setosa
## 4          4.6         3.1          1.5         0.2  setosa
## 5          5.0         3.6          1.4         0.2  setosa
## 6          5.4         3.9          1.7         0.4  setosa
  1. Principal Component Analysis (PCA) is a dimensionality reduction/ feature selection technique aimed at increasing the comprehensibility of a model with a goal of minimizing information loss in the process. Create a variable to perform Principal Component Analysis (PCA) and name it res.pca, assigning it to only the numerical columns (negating the last one). Ensure to normalize the data by scaling it.
res.pca <- prcomp(iris[, -5],  scale = TRUE)
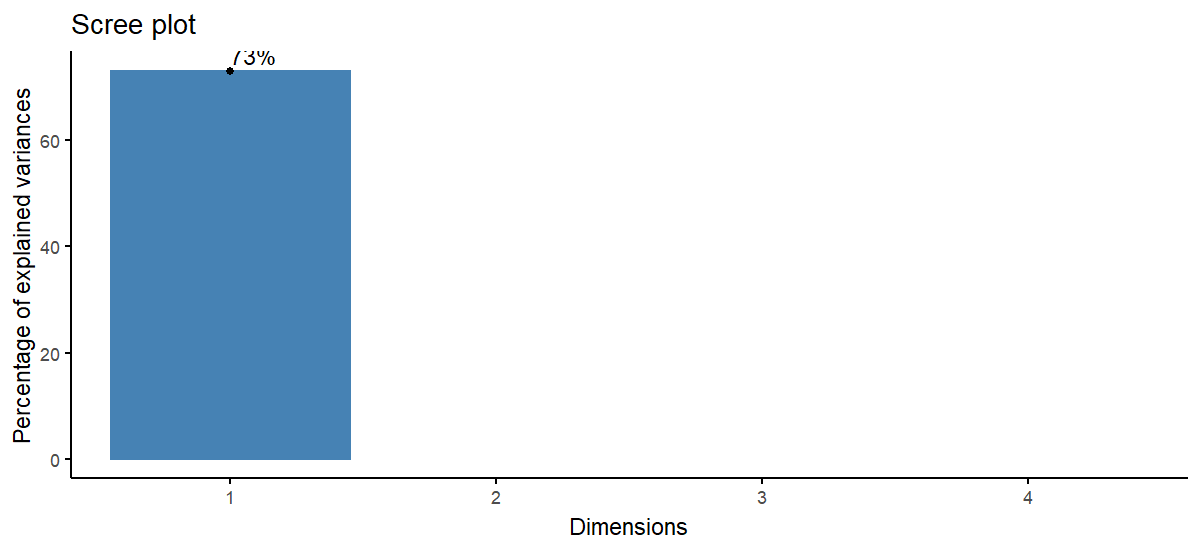
  1. Each principal component carries with it a percentage of variance that it accounts for in the model. Create a new variable to measure variance explained and assign it to var_explained. Note Keep in mind that this next line will be useful for subsequent renditions of PCA involving other datasets.
var_explained <- round(res.pca$sdev^2/sum((res.pca$sdev)^2)*100, 4)
  1. Obtain the eigenvalues of the PCA function using get_eig().
get_eig(res.pca)
##       eigenvalue variance.percent cumulative.variance.percent
## Dim.1 2.91849782       72.9624454                    72.96245
## Dim.2 0.91403047       22.8507618                    95.81321
## Dim.3 0.14675688        3.6689219                    99.48213
## Dim.4 0.02071484        0.5178709                   100.00000
  1. Create a visualization function using fviz_eig(), parse in the relevant parameters, and store it in a new dataframe fviz.
fviz <- fviz_eig(res.pca, addlabels = TRUE, ggtheme=theme_classic())+
  geom_line(size=1, color="blue")
  1. This step finally leverages gganimate() to add animation to the visualization. Add the fviz dataframe to the transition effect transition_reveal(), ensuring to correct the animation direction by making the transition a function of a sequence along the explained variance var_explained. Assign this to a new dataframe animated.
animated <- fviz + transition_reveal(seq_along(var_explained))
  1. Animate the scree plot visualization by calling animate on the animated dataframe, parsing in a suitable renderer, height, and resolution parameters.
animate(animated, renderer = gifski_renderer(), width = 1200, height=550, res=150)

Previous